Using SVG in Document Management
Keywords: xml, svg, content management, knowledge management, data visualization
Knowledge Visualization
By taking advantage of open source products, and by stretching the definition of location, we were able to program xml and SVG tools to perform many of the functions of a standard geographic information system (GIS). Additionally, we were able to develop prototypes of document management, content management and knowledge visualization tools that are not easily available through standard GIS tools.
Table of Contents
1. Problem Statement
The federal government, and in particular the Environmental Protection Agency (EPA), has both struggled with and utilized geographic information systems (GIS) tools for many years. The value of these tools cannot be overstated. Knowing where one is located, as well as where the resources one needs are located offers insights to problems that were essentially not available prior to potent GIS systems. Many other technical advances including the powerful desktop computer, the internet and web markup languages evolved very rapidly and concurrent with GIS technology. Within the EPA during this same timeframe, regulations helped spawn a system of analytical procedures for measuring pollutants that has evolved into a very large engine producing structured data.
As with any evolutionary phase of a new process, cooperative competition has been at work. Regulators with the EPA need to answer specific questions, while technology innovators need to push the limits of what the hardware and software can do. By providing ready-made and very structured data, the data produced through the analytical programs has been ideal for feeding and testing such advances. However, reviewing thirty plus years of experience shows that much useful data and knowledge is located within semi-structured data such as weekly reports and documents as well as within unstructured data such as phone calls and the water cooler conversation (Figure 1, “Data Comes in Several Forms”). This data and knowledge is not captured or utilized as effectively as it could be, especially considering its value as the “glue” that holds the structured, analytical data together.
2. Project Assumptions
This paper provides details of our original projects as well as updates on their current status. We also provide an overview of how we see these applications incorporating and being incorporated into multiple systems, creating a true storage area network (SAN). This journey has created a variety of paths available for further exploration that are far from the original charge of making a spreadsheet more useful. Perhaps the most important insight that we have incorporated is an understanding of the idea of modeling. There are two clear rules for any model.
• | Models do not “re-create reality”. Rather they “represent reality”. | |
• | It is the responsibility of all stakeholders to help develop the model’s parameters. It is not possible for the modeler to have sufficient expertise. |
A corollary to these rules is the requirement of useful and useable communication among all stakeholders. Therefore, it is incumbent upon all parties, but in particular the regulator community that has been entrusted to protect human health and the environment, to ensure that all stakeholders understand the consequences of various decisions. The decisions of all stakeholders have a direct impact on the model and consequently, the outcomes of that model.
We use the term business rules to label these collections of stakeholder decisions. Again, along a path not explored in this paper, when business rules reach a consensus binary state, they can be added easily to a model. As a single but important example, when the consensus boundaries of a site such as an operable unit (a subset of the whole site) have been defined, a binary question can be posed. “Is this data/entity/object within the boundary or is it external to the boundary?”
3. Document Management
Our project began via the request of a section chief. The chief received an excel spreadsheet every two weeks that had about 150 entries representing reports that were either overdue (red); approaching a deadline (yellow); or in the queue on schedule (green). His request to our team asked us to produce a GIS based tool to represent the same information that was contained within the spreadsheet (Figure 2, “Biweekly Excel Spreadsheet”). To fast forward a bit, our project now involves document management, content management, visualization of hard and soft knowledge, physical inventory, budgeting tools, and we are in the initial stages of developing some new forms of environmental modeling techniques. Our original project has proven quite fertile.
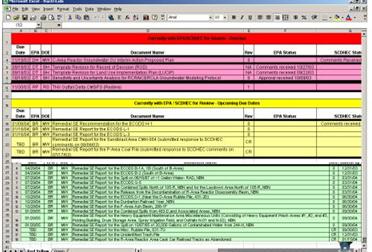
Overdue reports are in red rows; upcoming reports are in yellow rows; on schedule reports are in green rows
Figure 2. Biweekly Excel Spreadsheet
Over several months, we were successful in defining our customers’ needs and building working prototypes for the tools. However, two important events changed our project. The first was the reality that the tools we were building would require significant investment in such areas as a geospatial database as well as a difficult security clearance required by EPA for such applications. The second very significant event occurred when the section chief that had initiated the project was reassigned. We had garnered sufficient insight from the chief before his departure and the original resources remained in place. As a result, we had several months of funded time to try some more creative ways to solve the problems of semi-structured data use.
Our first recognition was that applications of the size that had been requested would have a hard time justifying the necessary hardware and software. Therefore, we chose to look toward open source and freeware for our tools. One of the first tools we found was Scalable Vector Graphics (SVG), a member of the Extensible Markup Language (xml) family of markup language tools. We experimented long enough to realize that SVG offered an inexpensive way to visualize locational data as well as to “attribute” those locations with additional information.
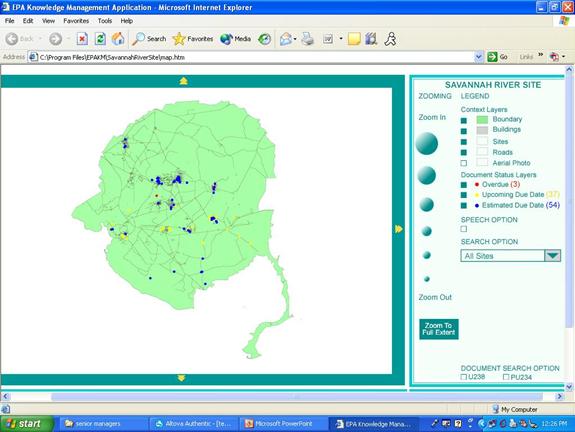
Our first functioning GIS system showed the information in the spreadsheet mapped to a geospatial application (Figure 3, “Functioning GIS from SVG”). We used a commercial software to convert Arcview shapefiles to SVG text files. It was possible to convert the shapefiles to ASCII and then add back in the appropriate attributes, but that was not efficient. We then added the centroid locations of the reports to the SVG map. (It is tempting to use the word ”layers” but that is not really appropriate in an SVG setting because all the information is at the same “level”. Again, a topic for future and further exploration.)
Our next step was to take very literally the idea of conceptual model. We conceived that each semi-structured report had a locational value, set either by legal boundary definitions (very rare) or by stakeholder consensus of what represented a potentially hazardous waste site (very common). Therefore, a report entitled “Operable Unit A Report” was very likely associated with the actual physical location known as Operable Unit A. We took the X and Y locations representing the centroid of OU A and added them to the attributes in the excel spreadsheet associated with each report.
Example 1. SVG pseudo code for representing centroids
<SVG>
 <circle cx = "X location of report centroid" cy = "Y location of
  report centroid" r = "appropriate value" />
</SVG>
Other attributes such as the name of the report, project managers, due dates, etc., were also easily included.
Example 2. SVG pseudo code for adding attributes to centroids
<SVG>
 <circle id = "Name of Report", "Project Manager", cx = "X location
  of report centroid" cy = "Y location of report centroid"
  r = "appropriate value" />
</SVG>
To emphasize the idea of a business rule, the business rule associated with the preceding examples can be stated as follows:
 | : Every report is associated with a physical location. In addition to other attributes about the report such as title, the X and Y values representing the centroid of that physical location will be recorded. |
Our second application function defined a set of polygons (rectangles for ease of development) that represent the stakeholder consensus opinion of the boundaries that represent various OUs (seventeen at SRS). The polygon definitions were BRs.
| : <OU1> <xmin> “minimum value for X represented in the OU” </xmin> <xmax> “maximum value for X represented in the OU” </xmax> <ymin>“minimum value for Y represented in the OU” </ymin> <ymax> “maximum value for Y represented in the OU” </ymax> </OU2> |
Applying this rule to the existing files provides a map of the OUs (Figure 4, “Adding Business Rules for Boundaries”).
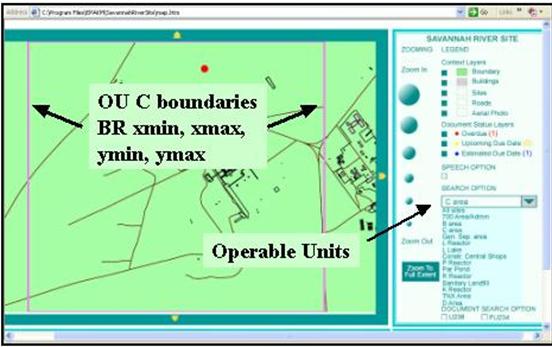
The pink rectangle represents the stakeholder consensus regarding the definition of an area of interest
Figure 4. Adding Business Rules for Boundaries
Figure 4, “Adding Business Rules for Boundaries” also shows several other end user features such as selecting layers to make visible; updating the status of reports (overdue, upcoming, on schedule); a speech option offering a form of 508 compliance); and zooming features. This tool seemed to meet the original request and can therefore be labeled Version 1.0. The user can view the locations and the status of all reports and can click on the location to link to a copy of that report – document management.
4. Content Management
Although we had completed a working version of the original project, because the requestor was no longer guiding the project, we pushed further by noting that each report was full of structured data in tables, generally analytical results from sampling efforts within and near an OU. By adding the additional locational attributes to the report, we gained the ability to query documents directly. In essence, this eliminated the need for the traditional primary key field of relational databases, for example having to match the report names to ensure all data was returned. We were constructing a single layered, hierarchical, geospatial, text-based database.
The implications of this type of data organization are quite broad. The most immediate for our work in the EPA is that the data can be retrieved and analyzed based not on the report in which it is located, but rather on where it is actually located. This is a powerful ally in the field of environmental restoration because each new sample has a small or sometimes large impact on the definition of the OU. Moving outside the scope of this paper, these systems are naturally evolving. The same need to evolve the model can be found in the prediction of infectious disease spread or the spread of forest fires. Stability is not possible in these models and the xml family handles these changes well.
The combination of these business rules allows us to ask questions such as – “Does Monitor Well 01 sit inside or outside of OU1?” While this may not seem like a great accomplishment, it is important to recognize that MW01 has a physical location while OU1 is nothing more than a mental construct based on stakeholder consensus. The “idea” of OU1 may change on a daily basis, but MW01 will remain in place. An advanced version of this application allows a project manager to first define an individualized polygon via the mouse or a pre-selected set of defined locations (via stakeholder consensus and rarely, legal boundaries). Having selected the required locations, the user can add data filters such as all chemical results that are above a regulatory limit, sampled in a certain timeframe, etc.
We used three prototype documents with tables embedded that carried two different types of chemicals – ChemA and ChemB. In practice, these documents are frequently thousands of pages of text, images and tables. Therefore, we created a blank html document to receive the end user query. In practice, an end user may query 1,000 pages of a report and have returned fifty lines of information. An important point of emphasis is that the name of the report is not relevant. Rather, it is the locations of samples inside the report combined with the ability of xml to reach inside the document and extract that specific data that is required. Essentially, the query is a business rule that will “burrow” through any connected dataset that contains the XY coordinate data, a semantically aware storage area network (SAN).
5. Same Engine, New Application
It is likely that the BRT would have met an untimely end except that we gained a new customer based on discussing that tool. We were asked to do much the same task for the divisional weekly report. The divisional weekly report provides an approximately 20 pages Word document to the division director describing important events for the week from the division’s 350 employees. Reviewing the weekly is a difficult task.
The weekly is developed from staff input to branch administrative staff. The input can arrive via handwritten note, phone call, email or verbal conversation. The administrative staff assembles the input into a Word document that is forwarded to the division administrative staff for review and forwarding. The entire report goes to the division director, while subparts continue to the regional and headquarters levels. Currently, this requires the creation of three Word documents each week.
Our first internal BR was to only map those weekly items that have an associated location (the large majority of items). For example, a spill site in City ABC may have a weekly item for several weeks in a row. Dealing with the other data, in particular data that covers the entire region (opposed to a single location), was set aside. As we revisited that question, a new link between management and field personal was recognized and exploited (see Section 6.1). Without reviewing all the details, the division has eight branches. Each branch oversees certain actual sites undergoing some sort of environmental control. Using the same principles as previously presented, we attached each weekly report item with a physical location, producing a geospatially aware map of the weekly report. Clicking on any one site extracts and re-presents just that item from the 20 pages of weekly report (Figure 5, “GUI for Division Weekly Reporting Tool”).
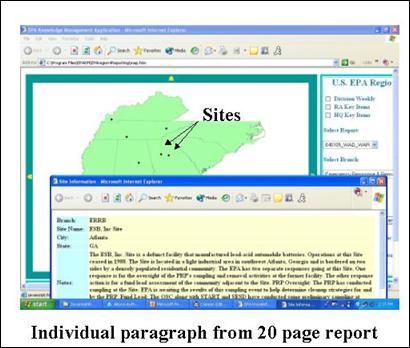
This tool uses the same idea as the previous tools, adding locational attributes to text reports
Figure 5. GUI for Division Weekly Reporting Tool
We also developed a VB script for the branch and division administrative staff to use that provides word processor type interfaces with “automatic” xml tagging. Importantly, because the procedure for submitting weekly reports has never been well defined, it was significantly easier to have the administrative staff migrate to this single system. The division version allows the administrative staff to create the three Word documents via a radio button type selection process using an xml transformation sheet (xslt).
As we have continued to work with the DWRT, it has become clear that the weekly report is most abundantly collected data in our division. Therefore, it must be at least marginally important to the business process. As we continuously add locational data to the weekly report, it becomes technically feasible to imagine a division director asking about the value of a single sample, although not a likely business scenario. More likely, the manager may wish to create a standard or one-time BR to inquire about schools or hospitals within one mile of a site. Because the site has locational value, that query can be bundled and sent to other databases in remote locations, with the results returned via a single, separate html document.
We are in the process of incorporating another BR in the DWRT that will visually change the appearance of any site that is listed three times in any six week period. This is a good example of the modeler’s responsibility. Technically, the model developer has no idea that a site that reappears with some frequency is of value to the division director. Rather, it is the director’s expertise that defines the BR. The modeler may chose how the visualization changes, but not the rules to make it change.
6. Future Research
6.1. Physical Inventory System
Through good work and good marketing, we have garnered additional funding to continue some level of development with these tools. Our first project will be the development of an inventory control system that will also link the project manager to the management team. When a manager says “What’s going on at Site A?”, the mental model is not that of the physical Site A, but rather of the project manager that runs Site A. The project manager has a physical location, such as an office. We will obtain maps of the two floors where the division staff of 350 is located. We will link each area (the same operation as defining OUs or other semantic labels for locations) to a project manager (or other appropriate link). The project manager has attributes such as a phone number, email address and calendar. As well, the project manager has assigned to him or her a computer, a laptop, a PDA, a pencil, etc.
We intend to build both a physical inventory control system (with the intention of adding radio frequency IDs (RFIDs) for tracking equipment– outside topic area for this paper) and a method to display data to the division management team effectively. For example, if the director asks the question, “Who is coming to the training session?” that has no actually physical locational value. However, if each staff person has an attribute called “Training Schedule”, then a visual map of the office with the staff people who will be attending the training can be displayed. Other quick information such as phone number and calendar can easily be incorporated.
An important implication of this idea is the linking of physical locations through project managers who see the actual location when the words “Site A” are mentioned and the executive managers who see the project manager when “Site A” is mentioned. This would seem to be a generally applicable rule for business. A sales manager sees the stores and people who buy the goods while an executive manager envisions “the sales region” as that sales manager, etc. We could technically track a measure of inventory, staff time and weekly reports to provide costs for individual sites. This is in practice not nearly as easy to do, particularly in dealing with quality of life issues such as environmental restoration.
6.2. Display of Soft Knowledge
Building on the idea of the strong link between semantic values and modeling, we have utilized the opacity property of SVG to provide a means for displaying soft data. As this paper has stated, the consensus opinion of all stakeholders is the most effective model available. Each stakeholder will likely view the solution as inefficient because each stakeholder has had to compromise certain positions in order to have any actions begin, but the overall solution will settle in (associated with neural networks – outside topic area) to the most accommodating solution.
Much more so than the other ideas presented in this paper, these ideas are strongly linked with stakeholder input and perceived risk, as well as group dynamics. While the ideal is to settle into the most accommodating solution, without strong and often formal leadership, the group can be dominated by certain personality types. Therefore, while we present idealized situations, it is necessary to recognize the level of effort that is required to reach these consensus decisions. Each group must be educated regarding other groups’ viewpoints. A common language must be developed that will include certain technical terms, requiring an educational process. Difficult to measure quality of life issues must be debated and ultimately, must reach true consensus before even the best scientific models will be able to stand the scrutiny of the regulated and the governed.
Within the EPA, a second generation environmental management strategy known as the Triad approach requires the development of a Conceptual Site Model (CSM) that represents the site and the issues surrounding its restoration. We conceive that the tools described in this section may serve as a CSM. Additionally, the Triad approach requires the establishment of a hypothesis to be proved or disproved through the collection of data. This is a basic premise of the scientific method - propose a hypothesis and test against it. It is also true that this premise is oft ignored in the quest to have the experiment be a success. In the environmental arena, this can be seen when samples are collected and then analyzed to determine the nature and extent of a potential contaminant. More appropriately, the nature and extent of the contaminant based on existing data should be proposed and then a sampling scheme should be developed to prove/disprove that hypothesis. It is in this phase that stakeholder consensus is particularly important. In essence, once the model has been constructed, the data collection and analysis is “trivial” in the mathematical sense.
In the environmental arena, the implementation of the ideas presented in the preceding paragraph provides that each type of sample must have a designated area (or other appropriate spatio-temporal address) of influence. Within that area, each sample of like type will operate according to a set of consensus business rules. One subset of rules are those related to regulatory directions for quality control and quality assurance. However, there are other sets of BRs at play. For example, a citizen whose family lives near a potentially hazardous waste site will hope that every sample has as large an influence as possible. In that way, the most contaminant will be mapped. A land developer will hope that every sample has as small an influence as possible so that the land can be rapidly developed. The politician wants the tax base to be restored while protecting the citizenry. The regulator needs to ensure that the law is followed, etc.
Figure 6, “The Display of Soft and Hard Knowledge” shows the results of the tool. Using the example of a hazardous waste site, we show three types of data. The large, nearly transparent red circle on the left of the mpa represents employee memory, for example remembering dumping drums somewhere in that area. The smaller somewhat transparent circles within the larger circle represent field samples, valid but not as strong as lab samples (at least in this scenario. The values for both diameter and opacity are set by consensus BRs). To the right side of the map are several lab samples. The red and green colors represent whether the value at that sample site exceeds or does not exceed a value.
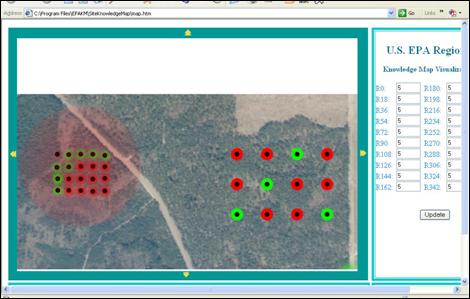
The “softer” the knowledge, the less opacity is used for the marker.
Figure 6. The Display of Soft and Hard Knowledge
An important aspect of this model is that the areas of influence for each type of sample, as well as the “weight” of each sample as indicated through opacity were determined prior to sample collection. This is appropriate in that the samples either prove or disprove the hypothesis according to the consensus stakeholder opinion. The converse method, sample and then analyze for patterns, can be subjected to second guessing, driving up costs later in the process. By agreeing to the basic ideas of the model prior to sampling, the outcome is more difficult to question.
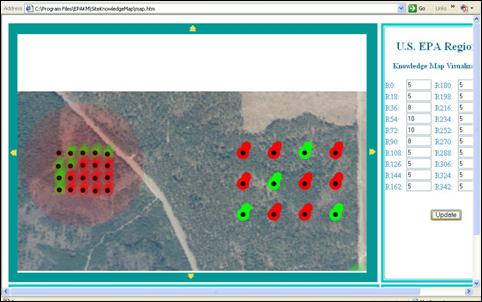
In our application, we added a feature that incorporates all stakeholder opinions into a vector quantity. Again, by example, if the groundwater model indicates a movement to the northeast, while the land developer believes it to only move half that much, the final vector of influence for each sample would be mapped as in Figure 7, “Shifting the Area of Influence Based on Stakeholder Influence”. The area of influence extends to the northeast, but not as far as the groundwater model indicates. Of course, adding in the citizens, regulators and others would dramatically alter the area of influence for each sample. However, regardless of the final shape, it will represent the most effective solution to the problem.
7. Conclusions
We have frankly been amazed at the development capacity within the xml family. We have yet to explore either commercial tools or incorporation of geographic markup language (GML) that has many useful qualities for organizing spatial and spatial-like data. Perhaps the most unexplored area of investigation is the visualization of soft knowledge, but there is room for development in a myriad of directions. We are excited about the ease with which working prototypes can be developed for very specialized applications while concurrently providing opportunities to link those individual applications together into broader scales of view, making it easier to understand how individual efforts fit within the overall business process.
Acknowledgements
- [BOOK1]Extensible Markup Language http://www.w3.org/XML
- [BOOK2]Scalable Vector Graphics http://www.w3.org/Graphics/SVG
- [BOOK3]Links to SVG and mapping sites http://www.carto.net/papers/svg/links
- [BOOK4]SVG Unleashed, Andrew Watt et al, 2003, Sams Publishing
Biography
Richard Hammond has worked in the environmental restoration industry as a field geologist and Geographic Information Systems specialist. In 1997, Richard formed and still heads the USEPA Region 4 (Atlanta, GA) Electronic Knowledge Management (EKM) Team. In this capacity, Richard has specialized in visualization of technical and scientific data to a variety of audiences.
Kiran Batchu works as a GIS developer for GeoDecisions and has been involved in the GIS industry for about five years. He has degrees in Civil Engineering, Environmental Planning and GIS. His work consists of providing a wide range of GIS services ranging from spatial analyses to software customization using GIS industry standard softwares. Since the past one year, he has been developing GIS like solutions using the xml family of standards mainly xml and svg for data management and visualization.